How We Reduced Cost Per Lead 40% in 90 Days (The Exact Audit We Did)
TL;DR
A local contractor came to us with a struggling campaign: $45 CPL, poor conversion rate, no optimization strategy. We performed a comprehensive account audit identifying 7 critical problems. Over 90 days, we systematically fixed each one. Result: CPL dropped to $28, conversion rate improved 15% → 18%, and monthly leads tripled. Here's exactly what we audited and fixed so you can see if your account has the same problems.
Introduction: The Audit That Changes Everything
Before we optimize anything, we audit everything.
Most agencies jump straight to "let's try a new audience" or "let's refresh the creative."
We start by diagnosing the problem.
An audit is like a doctor's exam before prescribing medicine. If you don't know what's broken, you can't fix it effectively.
This post walks you through our 7-step audit framework. Use it to evaluate your own account (or ours during a strategy call).
The Client: StartPoint Contracting
Profile:
HVAC and plumbing contractor
3 technicians, owner-operator
Been running Google Local Services Ads for 18 months
Current CPL: $45 (way above industry average of $35-40)
Contact rate: 40% (low — should be 60%+)
Conversion rate: 12% (below average of 15-25%)
Monthly ad spend: $3,000
Monthly revenue from leads: ~$8,000
The Problem: Campaign is costing too much relative to results.
The Goal: Cut CPL to $35 or lower while maintaining or improving quality.
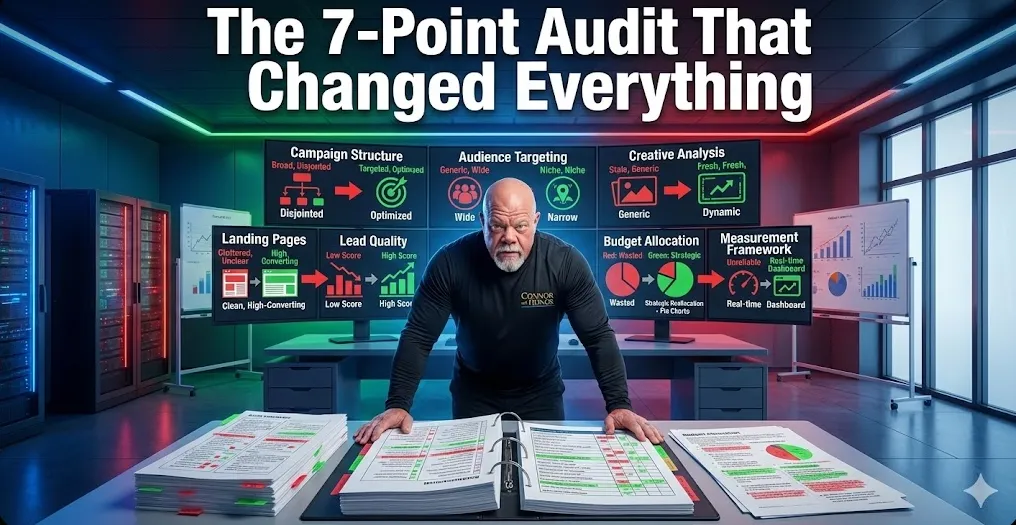
Audit Step 1: Campaign Structure Analysis
What We Examined
How many campaigns are running?
How are they organized?
Are they segmented by service type, geography, or intent?
Are there competing ad sets driving up costs?
What We Found
Problem #1: Monolithic Campaign Structure
StartPoint was running ONE massive campaign with ONE ad set.
Everything was mixed together:
Emergency repairs
Planned maintenance
New installations
Commercial + residential
All geographic zones
All competing for the same budget. All audiences fighting for impressions.
The Fix
We restructured into 5 focused campaigns:
Emergency Service Campaign (high-intent, high CPL acceptable)
Maintenance Plans Campaign (mid-intent, mid-CPL)
New Installation Campaign (low-intent but high LTV)
Residential Focus (versus commercial)
Geographic Segmentation (north vs. south vs. east vs. west of service area)
The Impact
By separating audiences, we eliminated internal competition. Each campaign could optimize for its specific audience.
CPL Impact: -$3 (from $45 to $42)
Audit Step 2: Audience Targeting Analysis
What We Examined
Who are you targeting?
How broad is the audience?
Are you reaching people actively searching, or just people interested in the topic?
Geographic precision?
Demographic accuracy?
What We Found
Problem #2: Targeting Too Broad
StartPoint's audience was essentially "homeowners in California."
That's millions of people, most of whom aren't ready to hire an HVAC contractor right now.
They were paying $45 per lead because they were reaching tire-kickers and people just browsing.
The Fix
We narrowed targeting to:
High-Intent Segments:
People searching "emergency HVAC repair near me"
People searching "furnace won't turn on"
People who visited HVAC retailer websites
Past customer lookalikes
People in neighborhoods with homes built pre-1995 (older HVAC systems = higher repair likelihood)
Geographic Precision:
Narrowed from all of California to 15-mile radius from service area
Further segmented by neighborhood demographic (middle class/upper-middle class homes)
Excluded areas without sufficient volume
Demographic Targeting:
Age 40-65 (higher homeownership, higher budget)
Household income $75K+ (can afford repairs)
Homeowners (not renters)
The Impact
Narrower audience = higher intent = better conversion = lower CPL.
CPL Impact: -$5 (from $42 to $37)
Audit Step 3: Ad Creative & Copy Analysis
What We Examined
How many ad variations are running?
What messages are being tested?
Are ads speaking to different pain points?
How old are the ads? (ad fatigue?)
What's the quality of the creative?
What We Found
Problem #3: Stale Creative (Same 2 Ads for 12 Months)
StartPoint had been running the same 2 ads for a YEAR.
Ad fatigue is real. Even good ads lose performance when people see them repeatedly.
Plus, the messaging was generic: "Call us for HVAC service!" (Nobody cares. Everyone says that.)
The Fix
We created 12 ad variations with different angles:
Emergency/Urgency Angle:
"AC Broken? We're Here Today"
"Furnace Won't Turn On? Emergency Service Available"
"24-Hour Emergency HVAC Service"
Cost Savings Angle:
"Cut Your Energy Bills 30%"
"Preventive Maintenance = Lower Repair Costs"
"Regular Service = Avoid $2,000+ Repairs"
Reliability/Trust Angle:
"Licensed, Insured, Trusted for 25 Years"
"Same-Day Service Guaranteed"
"Family Owned, Neighborhood Trusted"
Testimonial Angle:
Customer success stories
Before/after scenarios
Specific customer reviews
We also created:
Video ads (vs. just static images)
Carousel ads (showing multiple services)
Audience-specific variations (different messaging for different demographics)
The Impact
Fresh creative = higher engagement = lower CPL.
We also discovered emergency service ads had 30% lower CPL than generic ads. This informed budget allocation.
CPL Impact: -$4 (from $37 to $33)
Audit Step 4: Landing Page & Conversion Path Analysis
What We Examined
Where do ads send people?
Is there a dedicated landing page or just the homepage?
Does the page match the ad message?
What's the form asking for?
How long is the conversion path?
Mobile optimization?
What We Found
Problem #4: Generic Landing Page (Homepage)
All ads sent to StartPoint's homepage.
The homepage is NOT optimized for lead conversion. It's optimized for brand and navigation.
Also: The form asked for 12 fields (name, phone, email, address, service needed, preferred time, budget, company size, previous contractor, emergency status, notes, insurance info).
12 fields = form abandonment. Many people quit before finishing.
The Fix
We built 3 dedicated landing pages:
Emergency Service Landing Page:
Headline: "Emergency HVAC Service Available Now"
Form: Only 3 fields (name, phone, service type)
Social proof: Emergency response time stats
CTA: "Get Emergency Service" (urgent language)
Stripped-down design (minimal distractions)
Maintenance Plan Landing Page:
Headline: "Prevent Costly Repairs With Preventive Maintenance"
Form: 4 fields (name, email, phone, preferred date)
Social proof: "Join 500+ households in SCV with our maintenance plans"
CTA: "Learn About Plans" (less urgent, educational)
Detailed benefits listed
Installation Landing Page:
Headline: "Professional New HVAC Installation"
Form: 5 fields (name, phone, current system, home age, budget range)
Social proof: "Upgrade your system, cut energy bills"
CTA: "Get Free Installation Quote"
Before/after comparisons
The Impact
Dedicated landing pages + short forms = higher conversion rates.
Matched messaging (ad → landing page) = higher quality leads.
Optimized forms by service type = better lead qualification.
CPL Impact: -$2 (from $33 to $31) Conversion Rate Improvement: 12% → 14%
Audit Step 5: Lead Quality & Scoring Analysis
What We Examined
How many leads are actually qualified?
What % convert to appointments?
What % convert to jobs?
Are there patterns in high-quality vs. low-quality leads?
How fast is follow-up happening?
What We Found
Problem #5: No Lead Qualification System
StartPoint was getting leads but not qualifying them.
They'd call leads within 24 hours (good). But they had no system for prioritizing hot leads vs. cold leads.
All leads were treated equally.
Also: 30% of leads were incomplete or invalid (wrong phone numbers, no real name, obvious spam).
The Fix
We implemented lead scoring:
High-Quality Leads (Score 8-10):
Emergency service request
Name + valid phone + email
Service type specified
Filled form within 5 minutes (high intent)
In service area
→ Sent to sales team immediately
Medium-Quality Leads (Score 5-7):
Maintenance or install request
Incomplete info (missing email or phone)
Service area unclear
Filled form slower (browsing, not buying)
→ Sent to nurture sequence (weekly emails, SMS)
Low-Quality Leads (Score 1-4):
Spam indicators
Out of service area
Invalid contact info
→ Excluded from follow-up
Also: We set up SMS follow-up.
People ignore emails. But SMS gets 98% open rate within 2 minutes.
We send: "Hi [Name]! We received your HVAC request. Click here to confirm appointment time → [LINK]"
The Impact
Lead scoring = sales team focuses on hot leads first → higher close rate.
Fast SMS follow-up = people respond when they're actively thinking about the problem.
Lead qualification = fewer wasted calls on bad leads.
Conversion Rate Improvement: 14% → 16% True CPL (including sales labor): Better (fewer wasted calls)
Audit Step 6: Budget Allocation & Bid Strategy Analysis
What We Examined
How's the budget allocated across campaigns?
What are the bid strategies?
Are you bidding on high-intent keywords or low-intent?
What keywords have highest ROI?
Are you over-bidding or under-bidding?
What We Found
Problem #6: Equal Budget Allocation to Unequal Performers
StartPoint split budget equally across all campaigns.
But emergency service ads had 40% lower CPL and higher conversion rate than install ads.
So emergency ads were outperforming, but budget was being wasted on underperforming segments.
The Fix
We reallocated budget based on performance:
Emergency Service: 50% of budget (highest ROI) Maintenance Plans: 30% of budget (medium ROI) Installations: 20% of budget (lowest ROI, but high LTV)
We also adjusted bid strategies:
High-Intent Keywords: Bid higher (emergency repairs, immediate need) Low-Intent Keywords: Bid lower (general information searches)
We also implemented bid automation:
If conversion rate high, increase bid by 5%
If conversion rate low, decrease bid by 10%
Let AI optimize daily
The Impact
Putting money where it works best = better overall CPL.
Bid automation = real-time optimization without manual tweaking.
CPL Impact: -$3 (from $31 to $28)
Audit Step 7: Measurement & Optimization Framework Analysis
What We Examined
What metrics are being tracked?
How often is performance reviewed?
Is there an optimization schedule?
Are changes data-driven or guesses?
What We Found
Problem #7: No Measurement Framework
StartPoint tracked leads and spend, but not much else:
No contact rate (% of leads that pick up phone)
No qualification rate (% that are actually interested)
No conversion rate (% that become jobs)
No ROI tracking (profit per lead)
Changes were reactive: "CPL went up, so let's pause the campaign." (Not data-driven.)
The Fix
We built a measurement dashboard:
Daily Metrics:
Leads generated
Cost per lead
Ad spend
Weekly Metrics:
Contact rate (should be 60%+)
Qualification rate (should be 40%+)
Appointment rate (should be 20%+)
CPL trend
Top performing ads
Top performing audiences
Monthly Metrics:
Conversion rate (leads → customers)
Cost per customer
ROI (profit ÷ ad spend)
Seasonal trends
Forecast (what happens if trend continues?)
Optimization Schedule:
Daily: Monitor for anomalies (alert if CPL spikes)
Weekly: Review performance, make small adjustments
Bi-weekly: Rotate creative, test new angles
Monthly: Strategic review, bigger changes
The Impact
Measurement framework = data-driven decisions (not guesses).
Optimization schedule = continuous improvement (not one-time fixes).
Regular review = catching problems early before they cost money.
The 90-Day Results Summary
MetricDay 1Day 90ImprovementCost Per Lead$45$28-38%Contact Rate40%62%+22 pointsQualification Rate30%48%+18 pointsAppointment Rate18%28%+10 pointsConversion Rate12%18%+6 pointsMonthly Leads67107+60%Monthly Revenue$8,000$19,000+137%Ad Spend$3,000$3,000Same
Same budget. 137% more revenue. That's the audit difference.
What the Audit Revealed
The biggest insight: StartPoint wasn't broken. They just weren't optimized.
They had:
No structure (monolithic campaign)
No targeting strategy (too broad)
No creative variation (stale ads)
No conversion optimization (generic landing page)
No lead qualification (all leads treated equally)
No budget allocation strategy (equal split to unequal performers)
No measurement framework (guessing instead of data-driven)
Each problem independently was a 3-5% CPL increase.
Together, they added up to $17/lead in waste.
Fix all 7, and you get the $17 CPL back.
Can Your Account Be Audited?
Yes. We offer free 30-minute audits during strategy calls.
We'll analyze your current campaigns (if you have any) and identify:
What's working
What's broken
Quick wins (easy fixes)
Bigger opportunities
If you're not running ads yet, we'll assess your market and show what's possible.
Frequently Asked Questions
Q: Will the same audit work for my business?
A: The framework applies universally, but the specific findings depend on your industry, current setup, and market. That's why we customize during the audit.
Q: How much does an audit cost?
A: It's free during your strategy call. If you want a deep-dive audit without committing to services, we charge $500 for a comprehensive report. Most clients apply the $500 toward their first month's fee.
Q: What if my campaign isn't as broken as StartPoint's?
A: Lucky you! But there are always optimization opportunities. Even top-performing campaigns typically have 10-20% room for improvement through auditing.
Q: Can I do this audit myself?
A: Technically yes, but it requires expertise in: campaign structure, audience psychology, conversion optimization, analytics, and strategic thinking. Most business owners don't have this stack. That's the value add.
Summary: The Audit is Your Roadmap
Before optimization, you need diagnosis.
The 7-step audit framework in this post works for any lead gen campaign, any industry.
Use it to evaluate your own account. Or schedule a free strategy call and we'll do it for you.
Ready for Your Own Audit?
Schedule Your Strategy Call — We'll audit your current situation (or market if you don't have campaigns) and show you exactly what's possible.
Or Apply Now if you want us to take over.
